Depreciation & Amortisation (D&A)
The systematic expensing of an asset’s cost over its useful life: depreciation for tangible assets, amortisation for intangibles. Non-cash, so it reduces reported profit without a cash outflow, which is why it is added back on the cash flow statement. US filings spell it amortization.
Behind the balance sheet · 8 of 17Next: Useful Economic Life
Depreciation & Amortisation (D&A) · the mechanism
1 min read
Explain what D&A is doing on each statement, and build free cash flow without mistaking the add-back for cash the business keeps.
Where it comes up. A VP asks whether the free cash flow in your model is repeatable. Capex has run at half of depreciation for three years and nobody has said why.
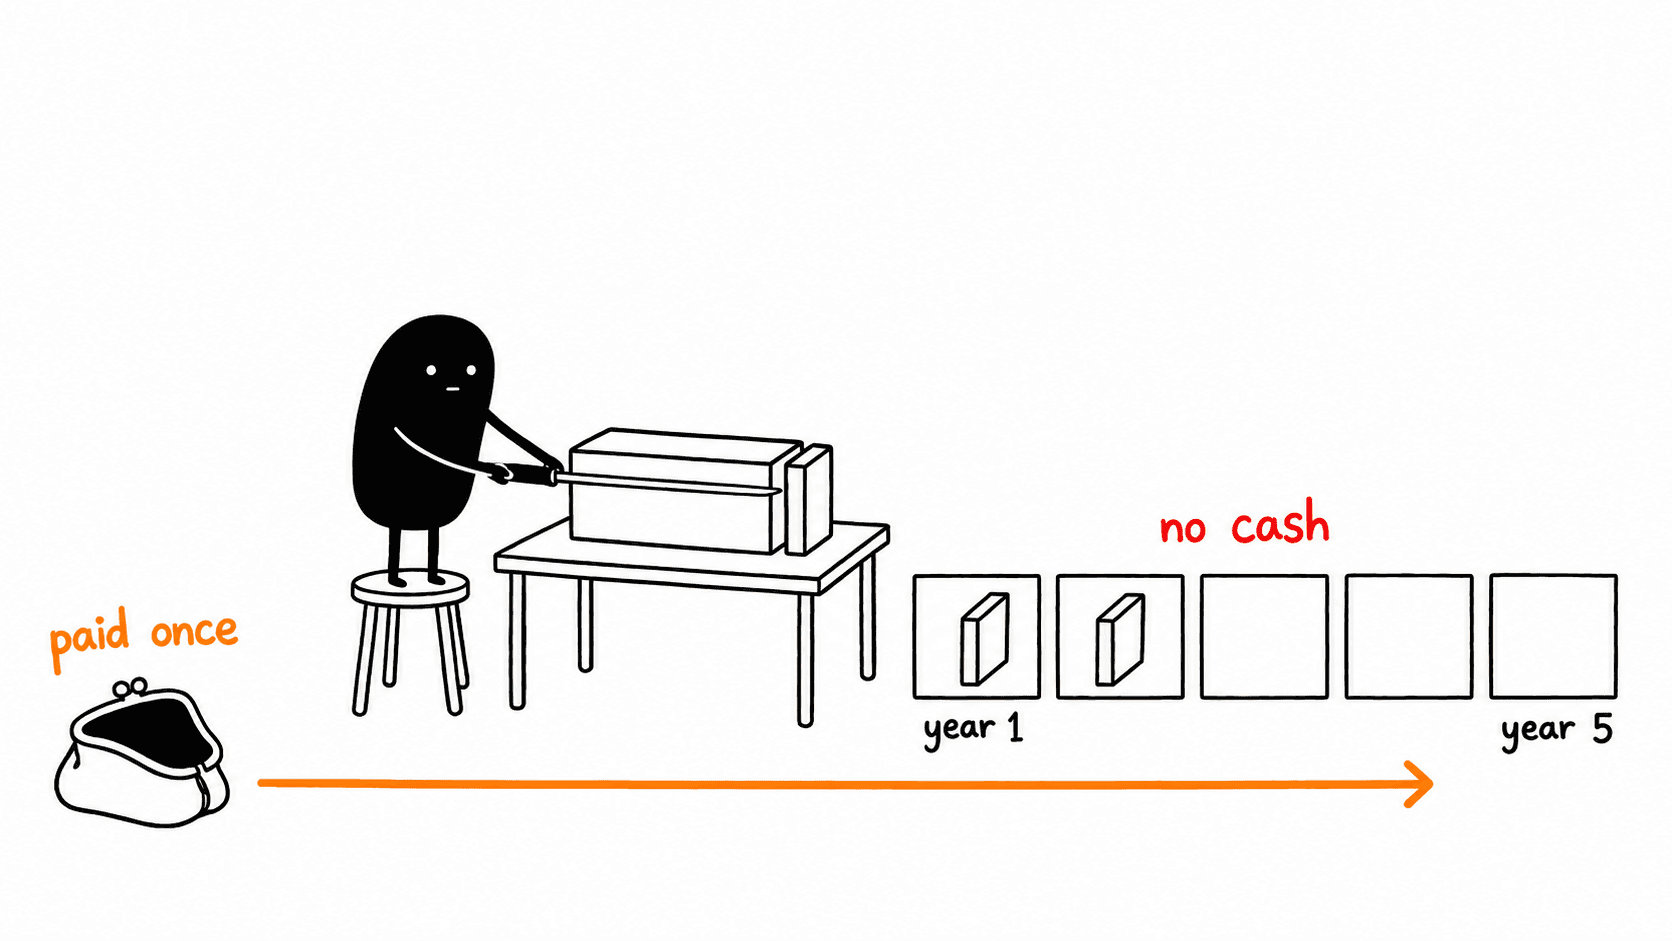
It spreads a past cash cost over time
The money left when the asset was bought. Depreciation spreads that cost across the years the asset is used, for tangible assets; amortisation does the same for finite-life intangibles such as acquired customer relationships or software. It matches the cost to the periods that benefit from it.
On the statements
It reduces operating income on the income statement, is added back on the cash flow statement because no cash moved this period, and accumulates against the asset on the balance sheet, reducing its carrying value.
The tax shield is the real cash effect
Because it reduces taxable income, depreciation saves cash equal to itself times the tax rate. That saving is genuine money, which is why $10 of depreciation increases cash by $2.50 at a 25% rate. It only exists if there is profit to shield.
The add-back is not free cash flow
Free cash flow adds the charge back, because no cash moved this period, and then deducts capital expenditure, because replacing the asset does cost cash. Add it back and stop and you have EBITDA, which quietly assumes the assets never wear out. Over a long enough period capex and depreciation converge for a business that is standing still, so the gap between them is where the question about repeatability lives.
Check yourselfA company reports capex consistently at half of depreciation. What is your read?
Answer once you have one →
Either it is harvesting, spending below the rate at which its asset base wears out and flattering near-term cash flow, or its historical asset base was built at a much higher cost than today’s replacement cost. The first is a sustainability question and the second is not. Which it is decides whether reported free cash flow is repeatable, so the question is worth asking before valuing it.
Be able to say this back next week
- Said it spreads a past cash cost over the periods that benefit
- Explained the tax shield as the real cash effect, and that it needs taxable profit to shield
- Added the charge back and deducted capex separately before calling anything free cash flow
Work it through
Where a D&A charge actually goes
Profit falls. Cash rises by the tax the charge saves, and only while there is taxable profit to shelter. Move the charge and the tax rate to see both.
Tax shield
£0.25m
The charge is not cash, but the tax it saves is. £1.00m × 25% is the cash you keep.
And the balance sheet closes
Cash
£0.25m
Net PP&E
−£1.00m
Total assets
−£0.75m
Retained earnings
−£0.75m
Assets move −£0.75m and equity moves −£0.75m. Equal, so it balances, and the business holds £0.25m more cash than it would without the charge.
Now do it under interview conditions, across all three statements.
Open the three-statement drillWhy Depreciation & Amortisation (D&A) matters in interviews
D&A is where an interviewer checks whether you understand that profit and cash are different things. It is the largest non-cash charge on most income statements, the first line added back in EBITDA, and the hinge of the "walk me through the three statements" question, so getting it wrong signals the accounting is not there.
How it works in practice
Depreciation spreads the cost of a tangible asset over its useful life; amortisation does the same for a finite-life intangible such as acquired customer relationships or software. A £10m machine with a ten-year life and no residual value carries £1m of depreciation a year on a straight-line basis. No cash moves in years two through ten. The cash left in year zero, when the machine was bought.
On the balance sheet the charge lands in one place: property, plant and equipment. The roll-forward is opening net PP&E, plus capex, less depreciation, equals closing net PP&E, and it has to hold in every period. Depreciation takes the asset off the balance sheet at the same rate the income statement is charged for using it, which is why a forecast that grows PP&E without a depreciation schedule behind it will not tie.
In a valuation the charge is deducted and then added back, and the two steps do different jobs. Deducting it before tax is what lets it reduce the tax bill, and that saving, the depreciation tax shield, is the only cash the charge is worth. Adding it back after tax removes the part of the expense that cost nothing this period. Capital expenditure is then subtracted on its own line, because replacing the asset does cost cash. Stop at the add-back and you have EBITDA rather than free cash flow.
Capex divided by D&A is the quickest read on whether an asset base is growing, standing still or being run down. Above roughly 1.2 times the company is adding capacity, around 1.0 it is replacing what wears out, and below 1.0 for several years it is harvesting the base and flattering near-term cash flow. Take the ratio across a full investment cycle rather than a single year, and read it next to what capacity actually did, because a software company capitalising development spend can run at 1.5 times while expanding nothing and a utility can sit at 1.0 for a decade and be perfectly well invested.
What candidates get wrong
- Saying D&A is added back "because it is not a real expense". It is entirely real. The cash went out when the asset was bought. It is added back because it is not a cash expense in the period being measured.
- Forgetting the tax effect. Candidates routinely say net income falls by the full charge. It falls by the after-tax amount, and the difference is the whole point of the question.
- Treating the add-back as free cash flow. Adding the charge back and stopping there gives EBITDA, which assumes the assets never need replacing. Free cash flow deducts capital expenditure afterwards, and the gap between those two lines is what says whether the cash is repeatable.
- Confusing amortisation of intangibles with amortisation of a loan. They share a word and nothing else: one is a non-cash charge against an intangible asset, the other is the repayment schedule of a debt principal.
Go deeperReading asset life out of the accounts, and why the charge climbs after capex peaks
The accounts imply an asset life of their own, so it can be read rather than assumed. Gross PP&E divided by the annual charge gives the average life the company is depreciating over. Accumulated depreciation divided by the same charge gives the average age of the base. The difference between them is roughly the remaining life: how many more years the assets already on the books keep charging before they roll off and the line steps down. Gross PP&E of £4,200m, accumulated depreciation of £1,800m and a £350m charge implies a twelve-year life, an average age of a little over five years, and about seven years left in what is already there. Use gross rather than net PP&E for the first division, because net is already part depreciated and gives you the remaining life by accident.
Forecasting the line properly means a waterfall rather than a ratio. Each year of capex becomes its own layer depreciating over its own life, and the charge for any year is every live layer added together. That is why depreciation keeps rising for years after capex has peaked, why it falls away sharply when the opening base finishes its life, and why a percentage of revenue never reproduces the shape.
Depreciation & Amortisation (D&A): frequently asked questions
What does D&A stand for in finance?
Depreciation and amortisation. Depreciation allocates the cost of a tangible fixed asset, such as machinery, buildings or vehicles, across the years it is used. Amortisation does the same for intangible assets such as acquired customer relationships, patents or capitalised software. Both are non-cash charges: they reduce reported profit in a period without any money leaving the business that period, because the cash left when the asset was acquired.
Where do you find D&A in a company’s accounts?
On the cash flow statement, in the reconciliation from net income to operating cash flow, where the whole non-cash charge has to be added back. The income statement is unreliable for this, because depreciation is allocated to whichever line consumed the asset and sits inside cost of sales and SG&A rather than on a line of its own in many filings. Cross-check the cash flow figure against the property, plant and equipment note, which also gives the split between depreciation and amortisation and the asset lives.
Why is D&A added back to get EBITDA?
EBITDA is meant to show operating performance before financing and accounting choices, and depreciation policy is an accounting choice. Two identical businesses can report very different operating profit purely because one depreciates its assets over five years and the other over ten, and adding D&A back removes that difference. It also removes a real economic cost, which is why EBITDA is a starting point rather than a cash figure: free cash flow adds the charge back and then subtracts capital expenditure, and the difference between the two is what the business actually keeps.
What does a capex to D&A ratio above 1 mean?
That the company is spending more on new assets than the accounting charge for wearing out the old ones, so the asset base is growing. Around 1.0 times is a steady state where capex merely replaces what depreciates. Persistently below 1.0 means the base is shrinking in real terms, which flatters near-term cash flow and stores up a replacement bill. Read the ratio over three to five years rather than one, because a single large project distorts it in both directions, and check it against what capacity actually did over the same period.
Practise it
The schedule a real model uses: one layer per capex vintage, each depreciating over its own useful life, with the charge as the column total. Switch the life, switch to an accelerated method, or type over a capex year and watch the stack move.
Open Depreciation Waterfall, free, 10 minWhere Depreciation & Amortisation (D&A) comes up
Keep reading
IB technical questions guideRelated Accounting terms
Behind the balance sheet: keep going
Go further than reading
The written material is free. These are the ways to get it applied to your own work.
CV Review by a Human
Written margin-note feedback on structure, impact bullets and ATS-readability. Reviewed by Suro, not an AI score.
$25 48h turnaround
Cover Letter Review by a Human
Line-by-line review of argument, tailoring and tone, with a rewritten opening as a worked example.
$50 48h turnaround
L3VLUP Pro
The subscription: personalised alerts, Apply Packs, every answer marked, full history and the whole research library.
$25 /month
Browse the full glossary — 340 finance recruiting and technical terms, in plain English.